This article provides an overview of the new features and improvements introduced in version 12.1.
Manage Highlights
A Smarter Way to Start: The New Manage Home Page 🏠
Meet the new Manage Home Page — your intelligent launchpad to everything that matters.
Instead of landing directly in the Workspace, you now start with a streamlined, centralized view that puts connections, perspectives, and resources at your fingertips.
🚀 What You Can Do
🔌 Launch Workspace Instantly
Jump straight into onboarding and managing your technologies with a single click on Connect with Technology. No extra steps. No friction.
📊 Access and Create Perspectives
Open existing perspectives or create new ones in seconds—so you can structure and manage dashboards exactly the way your operations demand.
📚 Explore Product Resources Effortlessly
Access documentation, blogs, and the latest platform updates with one click—keeping you informed and ahead.
🧭 Navigate Smarter with the Toolbar
Core windows now live in the upper navigation toolbar, giving you improved visibility and faster access across the platform.
The new Manage Home Page isn’t just a starting point—it’s a smarter, faster way to take control from the moment you log in.
🔗 Explore: Manage Home Page.
🔄 Viewlets Are Now Widgets
A new name for a familiar experience.
Viewlets are now called Widgets across the Manage application. The functionality remains exactly the same—only the terminology has been updated for clarity and consistency.
All new and updated documentation will refer to Viewlets as Widgets going forward.
Same capability. Smarter naming. 🚀
📊 From Static Tables to Dynamic Visual Intelligence
Move beyond rows and columns.
Manage now delivers aggregation-driven dashboards that transform raw data into clear, actionable insights. With Bar, Pie, and Number Block widgets, you can instantly reshape the same dataset into powerful visual comparisons—highlighting distribution, comparisons, and critical values at a glance.
Switch aggregations. Reframe the view. Reveal the story behind the numbers.
Smarter visualization. Faster decisions. 🚀
🔗 Explore: Creating a Bar Chart Widget | Creating a Pie Chart Widget | Creating a Number Block Widget.
📈 Metric Trends — Time-Series Monitoring Made Simple
Don’t just see values—see how they evolve.
The new Metric Trends widget transforms selected metrics into time-series line charts, giving you continuous visibility into system performance.
🔹 Select What Matters – Choose the metrics you want to track.
🔹 See Change Over Time – Instantly visualize how values trend across time.
Turn static dashboards into dynamic, time-aware monitoring views.
🔗 Explore: Creating a Metric Trends Widget.
🚀 Get Started Instantly with Out-of-the-Box Perspectives
Want dashboards ready the moment you log in?
Out-of-the-Box Perspectives provide prebuilt views—so you don’t have to start from scratch. No manual setup. No empty screens. Just ready-to-use dashboards built for real-world operations.
🔹 Instant Operational Insight – Aggregation-based visualizations highlight key data at a glance.
🔹 Live Data, Fast – Enable the supported product, connect your environment, and dashboards begin populating automatically.
🔹 Flexible by Design – Use the prebuilt templates as your starting point or tailor dashboards and widgets to your needs.
Impressed so far? Connect with our team to enhance your Out-of-the-Box experience. 🚀
🔗 Explore: Out-of-the-Box Perspectives.
✨Smarter Pop-Up Dialogs, Built for You
Pop-up dialogs across Manage have been redesigned for a cleaner, faster, and more intuitive experience.
From dashboards to widget configuration, every major dialog now features a modern UI that reduces clicks and surfaces what matters most.
Configure faster. Navigate smarter. Work seamlessly.
🔗 Explore more in the 12.x sections of the Manage documentation. See Management.
See the difference. Experience the upgrade. 🚀
Redesigned Workgroup Server Connection Dialog 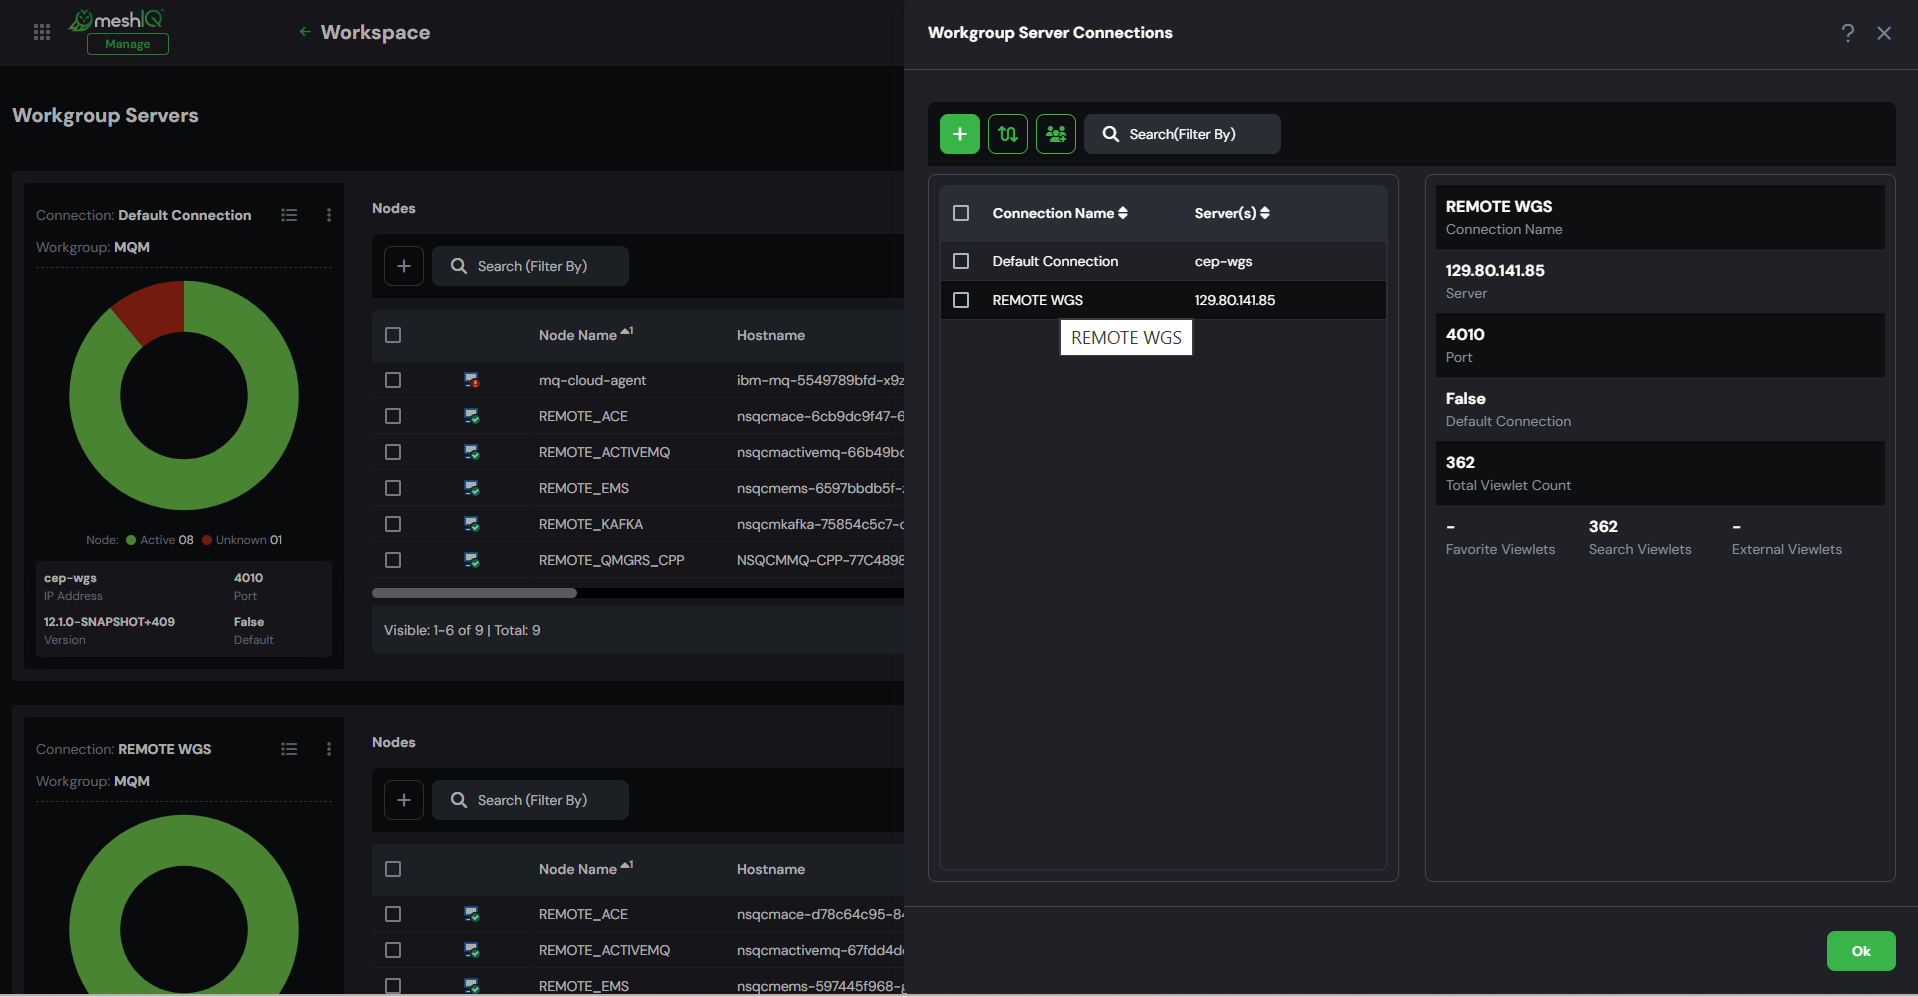 Redesigned Widget Creation Dialog
 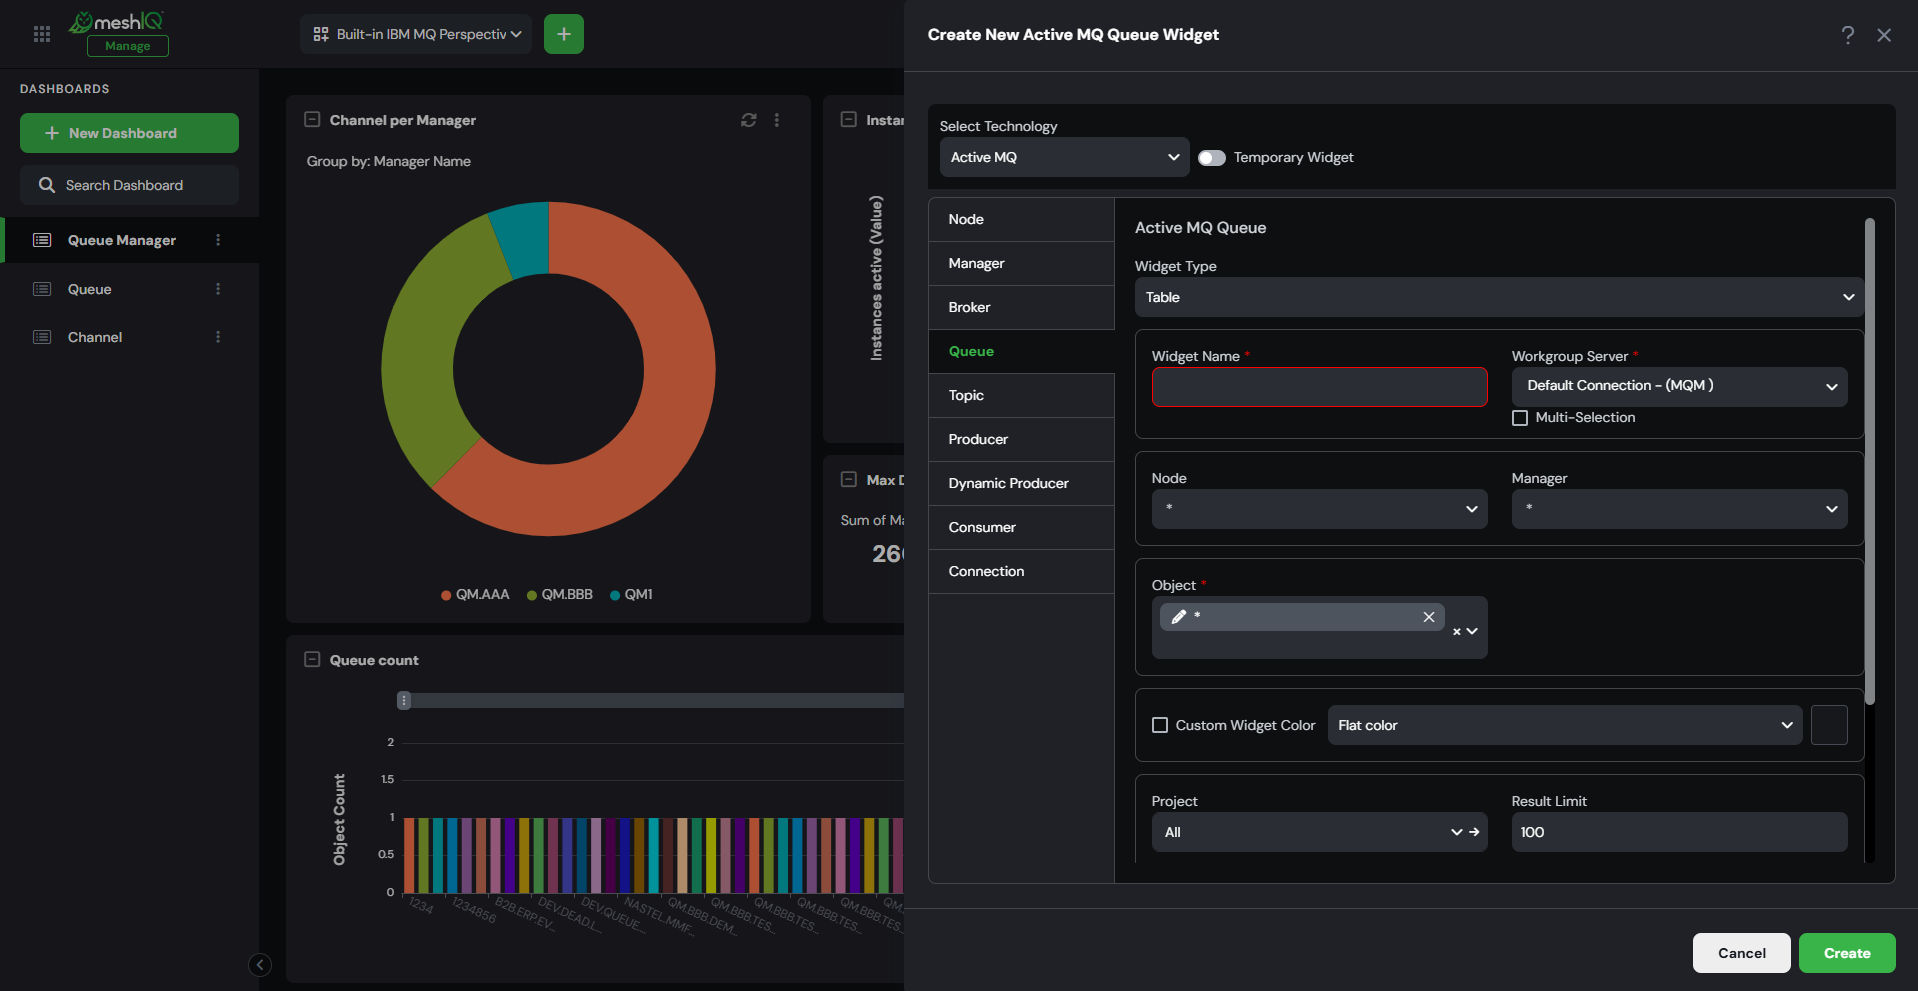 Redesigned Message Viewer Dialog
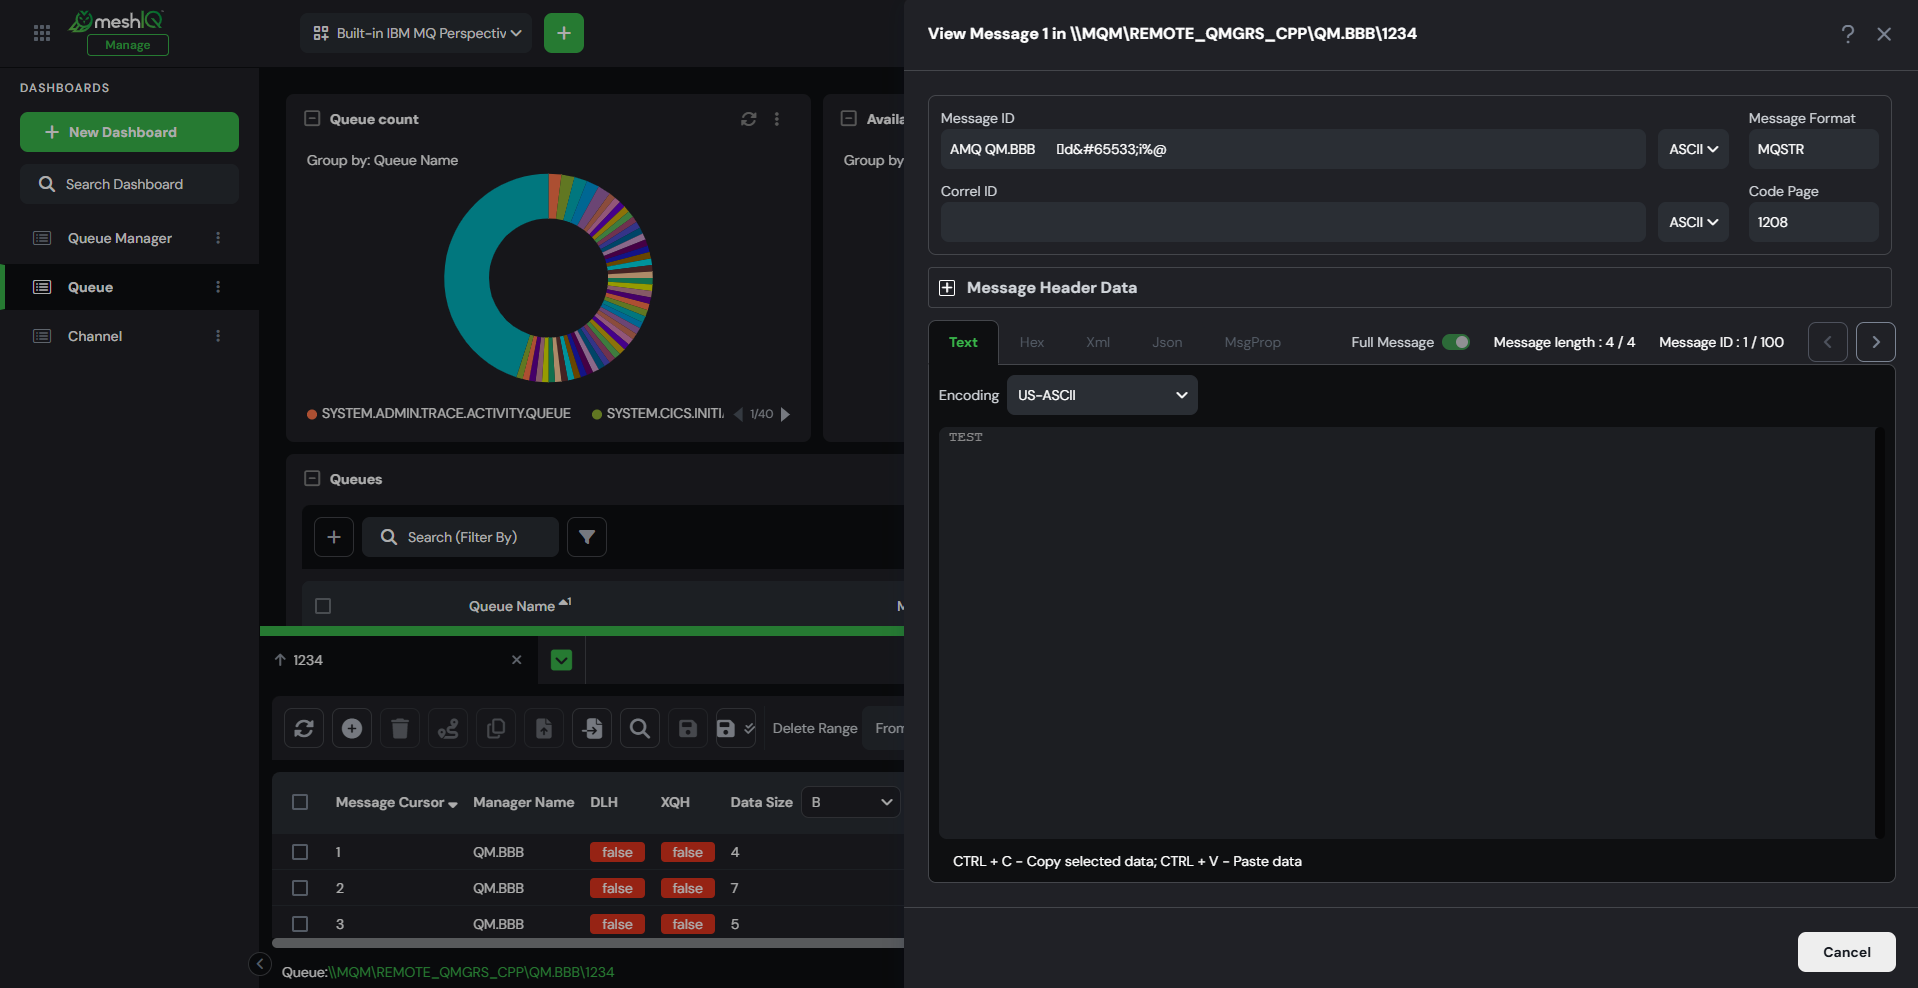
🎯Enhanced Visuals for the Workspace Dashboard
The Workspace dashboard has been redesigned for greater clarity, speed, and control—delivering a more visual and efficient way to monitor your environment.
🚀 What’s New
🔹 WGS-Based Widgets – Each Workgroup Server now appears in its own dedicated widget, creating a cleaner, more modular layout.
🔹 Color-Coded Node Status – Instantly identify active (green) and inactive (red) nodes at a glance—no extra clicks required.
🔹 Interactive Donut Charts – Hover for real-time visibility into node types and overall health.
🔹 Direct Node Actions – Node-level actions such as connection management and Remote Manager creation remain easily accessible.
Clearer visibility. Faster insights. Smarter monitoring. 🚀
🔗 Explore: Workspace Dashboard Overview
📊 Dashboards, Reimagined
Dashboard navigation now lives in a dedicated left-side panel—freeing up more space for what matters most: your data.
Collapse the panel anytime for a distraction-free dashboard experience.
🔒 Lock Layout ensures your widgets stay exactly where you place them—no accidental shifts, no rework.
More space. More control. Smarter dashboards. 🚀
🔗 Explore: Composable Dashboards | Lock Layout in Dashboards.
🖱️ Move It Your Way — Draggable Dialogs
Dialogs are no longer fixed in place.
You can now drag and reposition pop-ups anywhere on the screen—so they never block your view while you work.
🔹 Clearer Visibility – Keep dashboards and widgets in sight.
🔹 Smoother Workflow – Adjust your screen layout as you configure and edit.
More flexibility. Less interruption. Better everyday usability. 🚀
⚙️ Streamlined Settings for Users and Admins
The redesigned Settings window brings greater clarity, control, and simplicity—organized into three intuitive tabs for easier management of personal and system-wide preferences.
👤 User Settings
Personalize your workspace with confidence. Changes apply only to your account—giving you control without impacting others.
🌐 Application Settings
Built for Admins, these server-wide controls ensure consistent behavior across the environment. Permission-based access safeguards system integrity.
🚀 Initial User Settings
Redefining the old global settings, this tab sets the default experience for new users—powering smoother onboarding and simplified resets through Restore Initial Settings.
🔗 Explore: Settings Window
🔗 Smarter URL-Based Navigation
The Manage application now features dedicated URL routes for every page, making navigation faster, clearer, and more reliable. Perspectives and tabs are now reflected directly in the URL—allowing seamless browser navigation, easy bookmarking, and quick access to the exact view you need.
🚀 Faster Login and Improved Application Performance
Getting started with Manage is now faster and smoother. Performance enhancements ensure a quicker login experience while dashboards and widgets load seamlessly as you navigate through the platform.
⚡ Faster Access to Manage
Log in and start working quickly with improved responsiveness from the moment you access the application.
📊 Smooth Dashboard Experience
Dashboards and widgets render dynamically as you explore perspectives, keeping the interface responsive and efficient.
✉️Enhanced Control Over Message Headers
All Message dialogs—View, Edit, and Put—have been redesigned to deliver a faster, cleaner, and more structured experience for managing message headers.
Previously organized using vertical and horizontal tabs, message properties such as MD, MDE, DLH, XQH, RFH2, JMS, and PMO are now streamlined for better usability.
Here’s what’s new:
🔹 Centralized Header Access – All headers are now listed under a dedicated Contain Headers section for improved visibility.
🔹 Focused Editing Experience – Selecting a header and clicking Edit opens a new tab within the interface, keeping your workflow organized.
🔹 Structured Configuration – Header settings are grouped into logical subtabs (such as Identity, Reports, and Group for MD), making complex configurations easier to navigate and manage.
Less clutter. Clearer structure. Greater control over message configuration. 🚀
🔗 Explore: Messages | Filtering Messages
🏷️ Dashboard Tagging Made Simple
The Manage Dashboards window experience has been redesigned—cleaner, faster, and built for better control.
Dashboard tagging is now separated into two focused experiences—giving you more control and clarity:
🔹 Manage Dashboard Tags – Create, edit, and organize all tags in one centralized view.
🔹 Add Tags to Dashboard – Quickly assign or remove tags from individual dashboards.
More control. Greater clarity. Smarter dashboard organization. 🚀
🔗 Explore: Dashboard Tags | Manage Dashboards
🔎 Reimagined Attribute Filters
The Attribute Filters experience has been redesigned to make building and managing filters faster and more intuitive.
What’s New
🔹 A cleaner, simplified dialog for building filters with clarity
🔹 Faster condition selection with improved visibility
🔹 Reusable variables for greater flexibility
🔹 Instant visual feedback before applying filters
Whether you're creating a single filter or managing many, the new experience makes filtering easier and more controlled.
🔗 Explore: Attribute Filters
🌐 Improved Remote Connection Management
Remote connections are now fully managed at the node level with a redesigned Remote Manager Connection dialog for a cleaner, more intuitive experience.
🔹 Scoped Remote Connections – Add and import connections only to the selected nodes, ensuring precise node-level control.
🔹 Expanded Product Support – Node selection dropdown and editing of imported remote connections are now supported across all products, delivering a consistent experience beyond Kafka.
🔹 Built-In Validation – Receive warnings if an imported connection does not match the selected node, preventing configuration mismatches.
Stronger control. Greater consistency. Smarter connection management. 🚀
🔗 Explore: Remote Manager Connection
_________________________________________________________________________________________________________________
Observe New UI
🌐 Introducing the Observe UI — Built for Speed, Clarity, and Control
Meet the Observe UI, a modern monitoring experience designed to give teams real-time visibility, smarter alerting, and faster operational control. With a clean interface and powerful monitoring capabilities, Observe helps you stay ahead of issues and keep your environment running smoothly.
🚀 What Makes Observe Powerful
📊 Overview Dashboard
Start with a complete snapshot of your monitoring environment.
The Overview page brings together key insights across monitors, resources, schedules, alerts, and policies, helping you quickly understand system health at a glance.
✅ Smarter Monitoring
Create, view, and manage monitors with a streamlined setup experience.
View real-time alert statuses, severity levels, and metric trends—all in one place.
📈 Metric Trends
Visualize system behavior with live metric trends and quickly identify patterns, anomalies, or threshold breaches.
📅 Maintenance-Aware Scheduling
Define schedules that respect maintenance windows, reducing unnecessary alerts during planned downtime or updates.
📬 Flexible Notifications
Stay informed your way.
Send alerts through email or webhooks to ensure the right teams and systems receive notifications instantly.
📂 Resource Groups
Group related resources into logical sets and monitor them collectively for smarter, more focused operational visibility.
🔍 Advanced Filtering and Attribute Conditions
Pinpoint exactly what you need with powerful filtering and attribute-based expressions that let you analyze and refine resources with precision.
🚨 Alert Visibility
View alerts in real time when monitor conditions are triggered, helping teams quickly identify and respond to potential issues.
🔗 Integrated System Monitoring
Enable the System toggle to instantly display monitors, resources, and schedules created in the Manage application—bringing monitoring and management visibility together in one place.
🎯 User-Focused Experience
A clean, intuitive interface designed for everyday operations—making monitoring simpler for both new and experienced users.
⚡ Observe delivers real-time visibility, intelligent monitoring, and operational control—all in one powerful interface.
🔗 Explore the Observe UI to experience smarter monitoring.
_________________________________________________________________________________________________________________
Secure/Control Center
Rebranding meshIQ Secure to Control Center
The meshIQ Secure application has been rebranded as the meshIQ Control Center—bringing a fresh look, powerful new features, and a more centralized way to manage user access and system security.
🚀 What’s New in the Control Center:
Unified Access: All users now sign in through a single, secure login endpoint—no more version-specific URLs.
Repositories: Organize and manage data, logs, and configurations with the new Repositories feature.
Track Audit Reports: Get deeper visibility into application-level activity with Track Audit Reports, alongside existing user and database audits.
Same Powerful Model, Smarter UX: Manage users, groups, roles, server/object groups, audit rules, and settings—all in a more intuitive layout.
🔗 The Control Center is becoming the centralized security and access hub for all applications across the meshIQ platform, setting the foundation for unified governance and scalable enterprise control.
The new Control Center UI is designed for speed, clarity, and control.
🔗 Explore: Introduction to Secure/Control Center
👥 Manage Autopilot Users Directly from Control Center
User management for Autopilot is now available within the meshIQ Control Center, enabling administrators to create and manage Autopilot users without switching between applications.
🚀 What This Means for You
⚙️ Centralized User Management
Create and manage Domain users directly from the Control Center.
🔄 Automatically Synchronized Access
Users created in the Control Center are instantly reflected in Domain, ensuring consistent access across applications.
🧭 Simplified Administration
Reduce context switching and manage user access more efficiently from the platform’s central security hub.
🔗 Explore: User Management
📊 Introduced Track Audit Reports in Control Center
Audit reporting capabilities are now extended to Track, giving administrators greater visibility into actions performed within the application. From the Control Center, teams can review and export detailed audit logs to monitor activity, strengthen governance, and maintain better operational oversight.
🔗 Explore: Track Audit Report
_________________________________________________________________________________________________________________
meshIQ Platform
⚡ Powering the Platform with Apache Pinot
meshIQ is introducing a major platform-level enhancement by adopting Apache Pinot as the core data service engine. Designed for high-performance analytics on streaming and time-series data, Pinot brings faster data processing, improved scalability, and greater efficiency across the entire platform.
🚀 What This Means for You
⚡ Faster Data Insights
Experience quicker query responses and near real-time visibility into your operational data.
📊 Built for Streaming and Analytics
Leverage a modern analytics engine optimized for handling high-volume streaming and time-series workloads.
⚙️ Enhanced Platform Performance
This upgrade strengthens the data services foundation across meshIQ applications, enabling better scalability and a more responsive analytics experience.
🚀 meshIQ Meets Kubernetes – Your Platform, Now Cloud-Native
With meshIQ Platform 12.x, deploying and scaling observability, management, and tracking has never been easier.
You can now deploy the entire meshIQ stack—Track, Observe, and Manage—directly into your Kubernetes environment using a flexible and customizable Helm Chart.
🧩 Why Kubernetes + meshIQ?
Containerized deployments deliver everything you expect from a traditional meshIQ install—plus a world of new advantages:
- 🚀 Fast Deployment: Install the complete platform with a single Helm command.
- 🛠 Flexible Scaling: Customize resources per service and enable auto-scaling to match your workload.
- 🎯 Consistent Environments: Helm charts ensure predictable and repeatable deployments across environments.
- 🔄 Self-healing services: Built-in readiness and liveness probes automatically monitor application health.
- 📊 Enhanced observability: Integrate seamlessly with Kubernetes tools like Metrics Server, Prometheus, and Grafana.
- 💾 Reliable Storage: Auto-bound Persistent Volume Claims (PVCs) ensure data durability.
- ✅ Complete platform functionality: All core capabilities are available—even in the cloud.
Helm charts use containerized images of the full meshIQ platform. While Docker Swarm and Docker Compose are also supported, Helm is the recommended method.
Each deployment includes a basic license enabling all platform capabilities at a limited scale.
🚀 Bring meshIQ to the cloud—deploy with Helm and scale with confidence.
🔗 Learn more: Installing meshIQ with Helm
Automated Deployment with Ansible
Faster Installation. Consistent Environments. Enterprise-Ready Deployment.
Deploy the meshIQ platform quickly and reliably using Ansible-based deployment packs. With automated infrastructure configuration and standardized architecture, you can provision environments across multiple servers with minimal manual effort.
🚀 Why You’ll Love It
⚡ Rapid Environment Setup
Deploy the complete platform architecture using automated Ansible playbooks—reducing installation time from hours to minutes.
🧩 Standardized Enterprise Architecture
Predefined deployment packs ensure every installation follows the recommended meshIQ platform architecture.
🔄 Consistent and Repeatable Deployments
Eliminate configuration drift across environments with repeatable, version-controlled deployment scripts.
🌐 Multi-Server Deployment Support
Deploy components across distributed infrastructure by simply defining server IPs and ports in the configuration.
📦 Aligned with Containerized Installations
The deployment architecture aligns with containerized environments, enabling flexible deployment strategies across traditional and cloud infrastructures.
Seamless, Secure Login with the New Centralized Gateway
Introducing the meshIQ Centralized Gateway Login—your single point of entry for all GUI applications. Designed to deliver a unified, secure, and streamlined authentication experience, this gateway eliminates the complexity of managing multiple login flows.
🚀 Why You’ll Love It
🔗 One Gateway, All Apps
Access all meshIQ GUI applications through a single, consistent login experience—no more switching between portals.
🔒 Secure by Design
Built on industry-standard OpenID Connect (OIDC) to provide modern, secure authentication and token-based access management.
🔄 Seamless Application Switching
Move between applications effortlessly with a centrally managed application switcher—no additional logins required.
🏢 Enterprise-Ready SSO
Integrate with your existing Identity Provider (IdP) and enable SAML-based Single Sign-On for enterprise authentication.
⚙️ Flexible Deployment Options
Configure the gateway your way—via context.xml, environment variables, or JVM command-line parameters.
One login. Secure access. Seamless navigation across the meshIQ platform. 🚀
🔗 Click here to learn more.
Enhanced About Dialog with Build Number
Quickly view both the Version and Build Number for all meshIQ applications directly from the UI. Access it anytime from User Name → About Us in the top-right toolbar.
Context-Aware Delete Confirmations
The meshIQ platform now features context-aware delete dialogs based on the sensitivity of the item being deleted.
For higher-risk deletions, users are required to manually type "DELETE" to confirm, adding an extra layer of protection.
For routine deletions, a simple Yes, Delete / No, Keep prompt keeps the process fast and user-friendly.
This enhancement helps prevent accidental actions while keeping the experience efficient where it matters most.