Stream JMX is designed to monitor and manage your ActiveMQ Classic and/or ActiveMQ Artemis brokers. It processes JMX-based information and integrates it into the meshIQ platform for full-stack observability.
Communication with ActiveMQ components happens via JMX—either locally or across the network. All JMX-exposed metrics can be collected and monitored. Components that can be monitored include:
- ActiveMQ Classic/Artemis runtime metrics
- ActiveMQ Java Runtime Environment metrics
This information can be combined with data from other meshIQ-integrated sources such as operating system metrics or log files, giving you deep insight into the performance and operation of your ActiveMQ infrastructure.
Installation & Configuration
Prerequisites
To monitor your ActiveMQ brokers with Stream JMX, JMX access must be enabled.
ActiveMQ Classic
Enable remote JMX access by referring to the official documentation:
http://activemq.apache.org/jmx.html
ActiveMQ Artemis
Enable remote JMX access by following the guide here:
https://activemq.apache.org/components/artemis/documentation/latest/management.html#remote-jmx-access
meshIQ Platform Requirements
To support ActiveMQ observability, ensure your meshIQ platform includes one or both of the following:
meshIQ Observe
- The Process Wrapper must be deployed and running.
- In the Properties tab under TCP Options, enable
Accept TCP facts. - Set the
TCP port(default:6060) for your Process Wrapper.
Using deployed meshIQ Observe policies for ActiveMQ improves monitoring depth and usability.
meshIQ Track
- A streaming token must be generated for your repository.
Setting Up Stream JMX
Step 1: Configure ActiveMQ JMX Connections
Edit the config/connections.cfg file and define your connection properties. Example configuration:
{
  activemq.vm: service:jmx:rmi:///jndi/rmi://localhost:1099/jmxrmi
  ; activemq.vm: service:jmx:rmi:///jndi/rmi://${vm.host}:${vm.port}/jmxrmi
  ; activemq.vm.host: localhost
  ; activemq.vm.port: 1099
  ; activemq.vm.user: admin
  ; activemq.vm.pass: admin
  activemq.vm.reconnect.sec: 10
  activemq.agent.options: *:*!!10000!5000!10

  # For ActiveMQ Classic
  activemq.source.fqn:SERVICE=@bean:org.apache.activemq:type=Broker,brokerName=localhost/?
  BrokerId#SERVER=@sjmx.serverName#APPL=ActiveMQ

  # For ActiveMQ Artemis
  ; activemq.source.fqn:SERVICE=@bean:org.apache.activemq.artemis:broker="0.0.0.0"/?
  NodeID#SERVER=@sjmx.serverName#APPL=ActiveMQ
}
You can define multiple connection stanzas in the same file to monitor several ActiveMQ broker instances.
Scenario: Multiple Instances on Same Host with Different Ports
activemq.vm:service:jmx:rmi:///jndi/rmi://${vm.host}:${vm.port}/jmxrmi
activemq.vm.host: localhost
activemq.vm.port: 1099;1098;1097
Scenario: ActiveMQ Brokers on Different Hosts Using Same Port
activemq.vm:service:jmx:rmi:///jndi/rmi://${vm.host}:${vm.port}/jmxrmi
activemq.vm.host: host1;host2;host3
activemq.vm.port: 1099
Scenario: Arbitrary Host and Port Combinations
activemq.vm: service:jmx:rmi:///jndi/rmi://${vm.address}/jmxrmi
activemq.vm.address: host1:1099;host2:1098;host3:1097
Replace placeholders like
localhost,
0.0.0.0, and
hostX with actual values from
your environment.
Step 2: Configure Monitoring Output in tnt4j_dual.properties
Choose where to broadcast the collected JMX metrics. Edit config/tnt4j_dual.properties:
event.sink.factory.BroadcastSequence: ap,track
-
ap= meshIQ Observe (AutoPilot) -
track= meshIQ Track
Use one or both depending on your monitoring architecture.
For meshIQ Observe:
event.sink.factory.EventSinkFactory.ap.Host: localhost
event.sink.factory.EventSinkFactory.ap.Port: 6060
Set Host and Port to match your meshIQ Observe Process Wrapper configuration.
For meshIQ Track:
event.sink.factory.EventSinkFactory.track.Url: https://stream.meshiq.com
event.sink.factory.EventSinkFactory.track.Token: YOUR-ACCESS-TOKEN
Ensure the URL and token match your meshIQ Track repository credentials.
Running Stream JMX
Run Stream JMX using the following script:
./bin/stream-jmx-connect-file-config.sh ./config/connections.cfg
If your ActiveMQ broker uses SSL for JMX, add additional JVM system properties like so:
./bin/stream-jmx-connect-file-config.sh ./config/connections.cfg . . "-sp:javax.net.ssl.keyStore=client-keystore.jks -sp:javax.net.ssl.keyStorePassword=changeit -sp:javax.net.ssl.trustStore=client-truststore.jks -sp:javax.net.ssl.trustStorePassword=changeit"
The
-sp: flag passes JVM system
properties in the same way as
-D options. If using
bin/utils/su.sh,
you can configure encrypted passwords for added security.
Deploying the Process Wrapper in meshIQ for ActiveMQ Monitoring
The Process Wrapper is deployed on a meshIQ CEP server and listens a port. All data/metrics/information sent to this port are published as facts.
Stream JMX sends the collected metrics to the meshIQ CEP server using the port number specified for the Process Wrapper.
To Deploy the Process Wrapper:
- Right-click on CEP and navigate to Deploy Expert > Wrappers > Select Process Wrappers.
- In the create window, under General tab, set the Context field to
ActiveMQ_Monitoringand Name toActiveMQ_Monitor. - Navigate to Fact Options tab in create window and set the Expire Facts (ms) value to
600000(10 mins). - Navigate to TCP Options tab, enable the publishing of TCP facts, and define a port on which process wrapper runs (port should not be in use already).
- Deploy the expert, and once deployed, it is visible under CEP in Deployment View.
Editing Process Wrapper Properties
If minor configuration changes are needed post-deployment, you can edit the Process Wrapper properties as follows:
Steps:
- Open the meshIQ Enterprise Manager.
- Click the Deployment Tool to bring up the Directory Viewer (if not already visible).
- Right-click on
ActiveMQ_Monitorand select Properties.
For full documentation on configuring the Process Wrapper, it is recommended to review Sections 4.5.3 and 4.5.4 of the AutoPilotM6 Administrators Guide .
ActiveMQ Metrics
This section below describes some of the ActiveMQ metrics collected by the ActiveMQ Plugin.
The data presented is collected using JMX services and can be modified as discussed in the configuration section above.
The facts shown below are samples only.
ActiveMQ Metrics
Sample ActiveMQ metrics collected and published by Stream JMX.
ActiveMQ Java Runtime Environment Metrics
Sample ActiveMQ Java Runtime Environment metrics collected and published by Stream JMX.
ActiveMQ Sample Monitoring Policies
meshIQ provides a sample set of monitoring policies designed to analyze data collected by the ActiveMQ JMX plug-in. These policies offer immediate insight into your brokers' performance and behavior.
This article outlines the complete procedure for:
- Creating and deploying a Policy Manager
- Deploying policies under the manager
- Managing and starting policies through the meshIQ deployment tools
Create & Deploy Policy Manager
All monitoring policies must be deployed under a Policy Manager. The Policy Manager is responsible for:
- Starting and stopping policies
- Managing auto-start settings
Steps to Deploy a Policy Manager:
- Right-click on CEP and choose Deploy Manager > Default > Policy Manager.
- In the Create window, under the General tab:
- Set Context to:
ActiveMQ_Monitoring - Set Name to:
ActiveMQ_Policies(for ActiveMQ Classic) orArtemis_Policies(for Artemis brokers)
- Set Context to:
- Click Deploy.
Once deployed, the policy manager will appear in the Deployment View under CEP.
Deploy Policies Under the Created Policy Manager
During the installation process, policies are copied to the Domain VMs/servers under the naming/policies directory.
To deploy these policies under the policy manager:
Steps to Deploy a Policy:
- Open Business View Explorer.
- Expand the
ActiveMQ_Policiesdirectory to view available policies. - Right-click on a policy and choose Deploy As Policy.
- In the pop-up window:
- Choose the policy manager
- Click Deploy
- Repeat the process to deploy each required policy.
After all required policies are deployed:
- Go to the Deployment Tool
- Start the deployed policies from the deployment view
meshIQ Monitoring Policy Examples
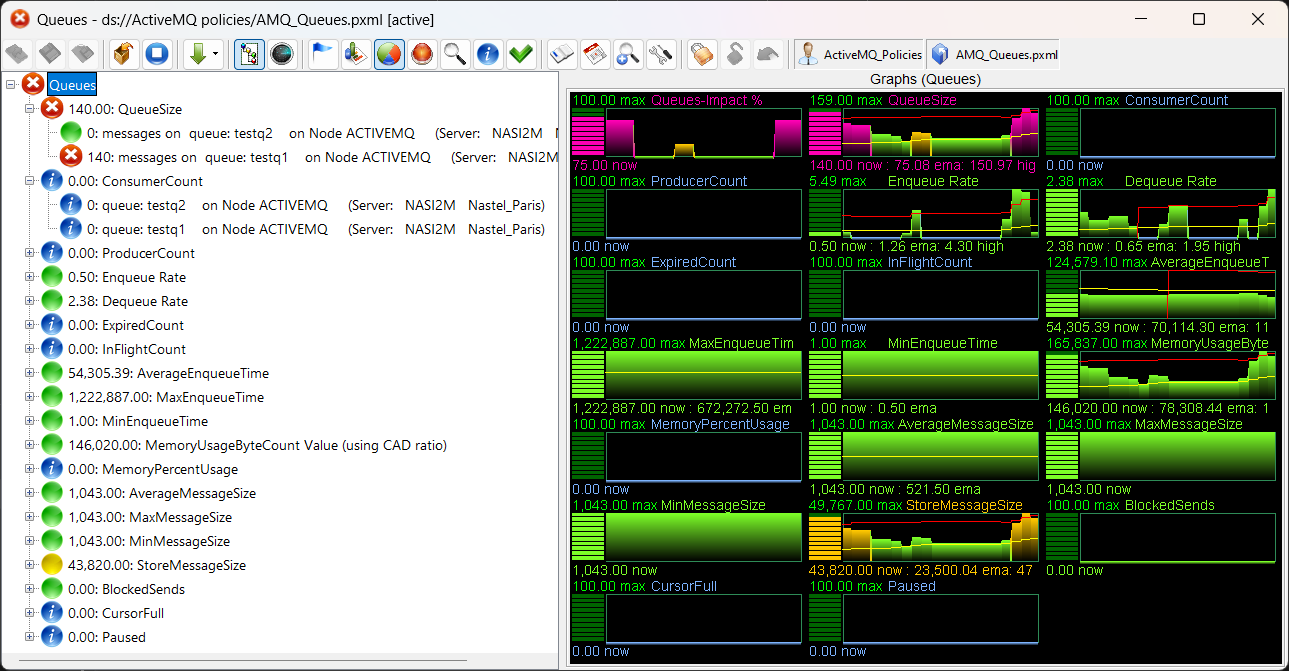
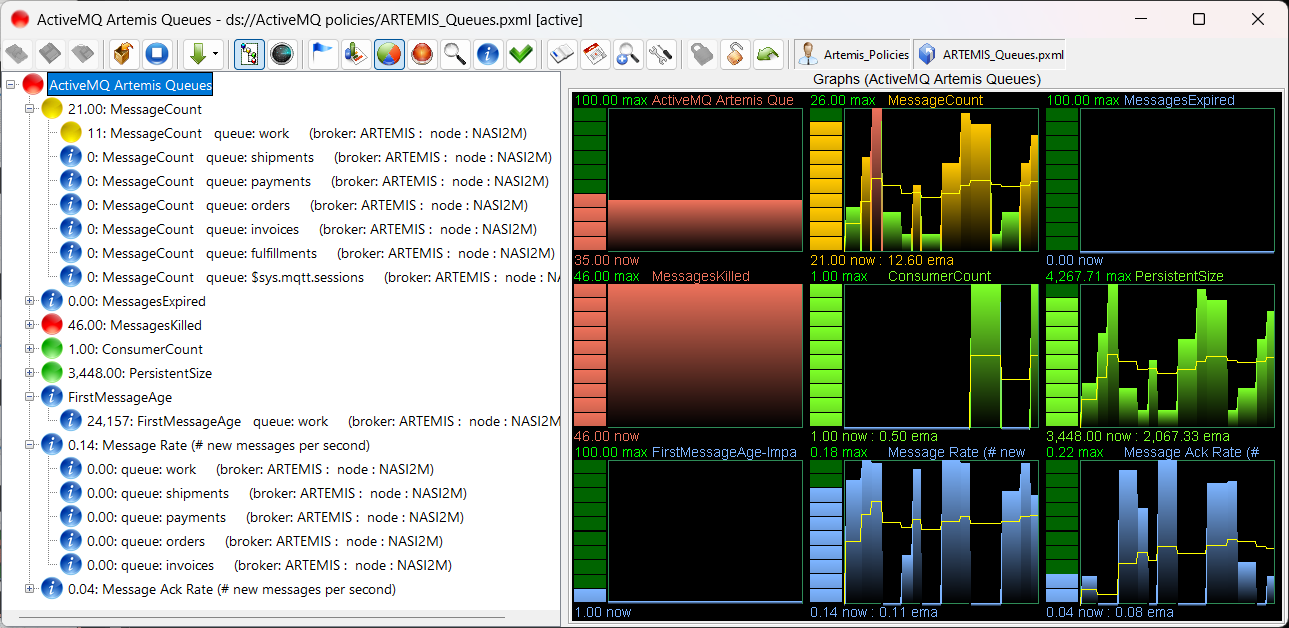
Sample meshIQ Observe Policies
The sample meshIQ Observe policy below shows real-time monitoring and alerting of messaging queues on ActiveMQ Classic brokers.
 Sample meshIQ Track Dashboards
The following sample meshIQ Track dashboard displays time-series analytics for ActiveMQ.